This past year marked a turning point for Canadian consumer insolvencies post-pandemic. The influence of unique factors that arose during the pandemic, including lockdowns, closed courts, collection agents either sidelined or working from home, unprecedented government support payments and a reduction in spending, all reversed course in 2022.
The result is that both consumer debt and insolvencies have turned sharply upward again.
What’s contributing to this shift? Are record-high interest rates to blame? Inflation? Or are we just picking up where we left off pre-pandemic?
In my year-end analysis, I will again outline the factors affecting the average Canadian’s ability to manage consumer credit and explain where I believe insolvencies are headed into 2023. Let’s dive in.
Table of Contents
Consumer Insolvencies on the Rise Again
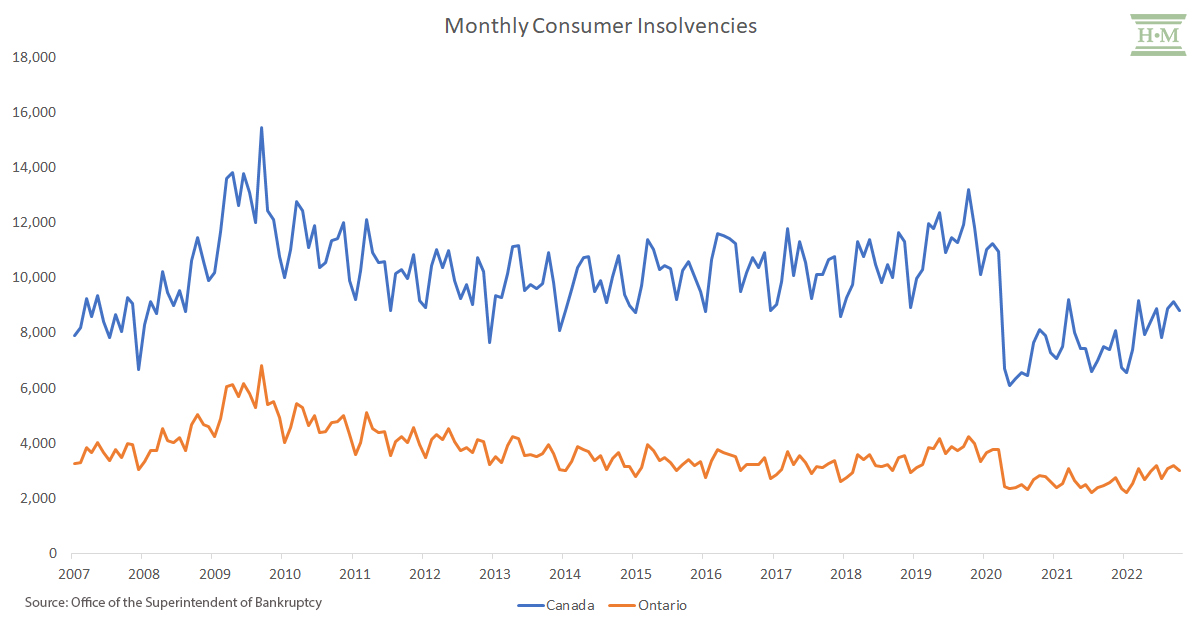
Total consumer insolvencies in Ontario were up 13.5% in the first ten months of 2022 (Canada up 10.5%), returning to growth after two years of declines. The pace of growth was stronger in the second half of the year, up an average of 24.7% in Ontario and 19.8% Canada-wide.
While volumes are still below pre-pandemic levels, economic conditions are driving insolvencies upward again.
Cost of Living Continues to Outstrip Wage Growth
Whiling living paycheque to paycheque does not mean someone is insolvent; higher living costs, combined with pre-existing consumer debt, can be a tipping point towards insolvency.
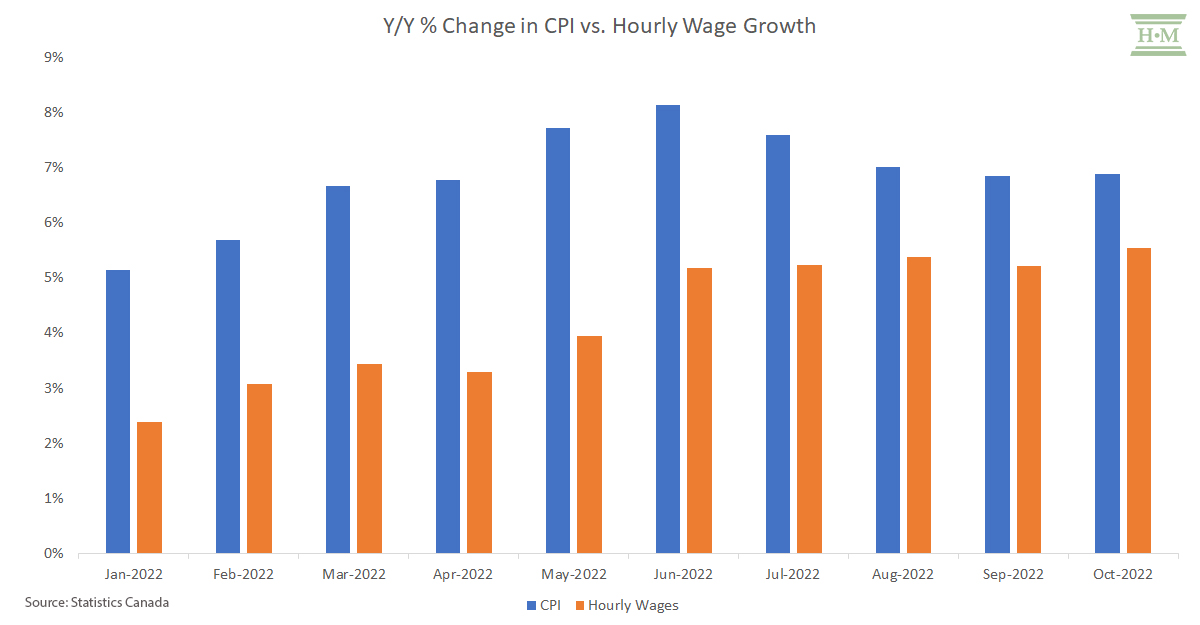
In 2022, the rise in the cost of living continued to outstrip any gains in wage growth. The Consumer Price Index rose 6.9% in October 2022, while employees saw their hourly wages increase only 5.6% year-over-year in October 2022. The gap between prices and wage growth averaged 2.6% for the ten months ended October 2022.
Our 2021 insolvent debtor profile study noted that the average insolvent debtor had just $203 a month available after living costs to meet debt obligations on consumer credit, a record low. High inflation over the past year will, I expect, drive this number much lower and push more financially vulnerable households toward a debt default.
Two primary areas of concern are increased food prices and rents, necessities which take priority over debt repayment.
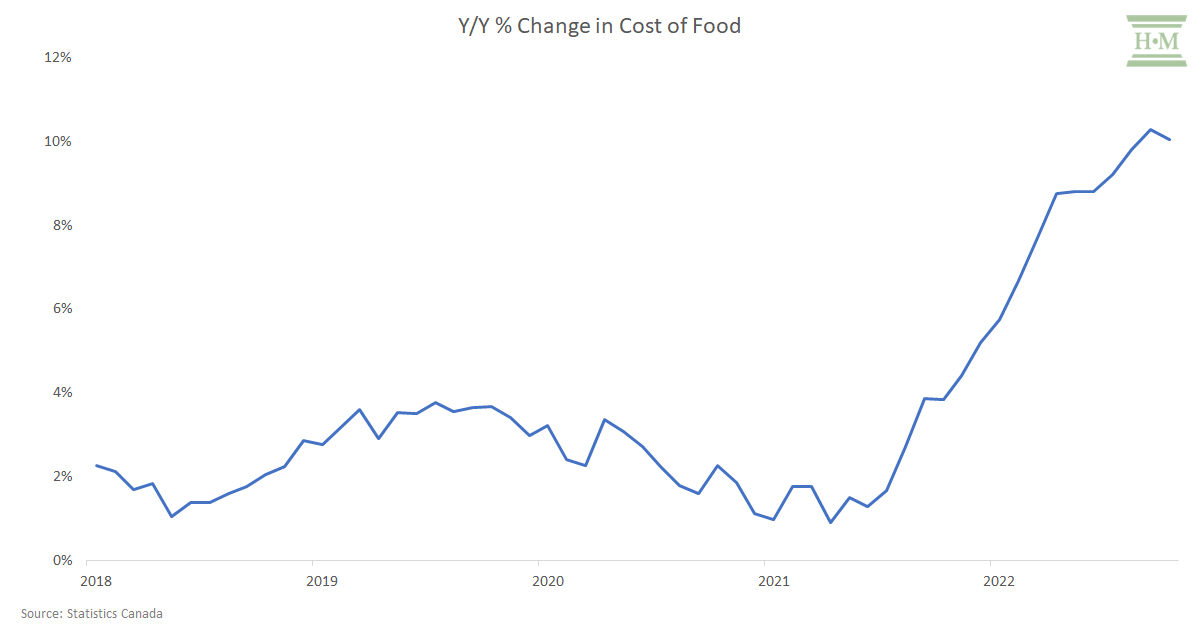
Food costs increased 10.1% year-over-year in October and are expected to rise another 5% to 7% in 2023.
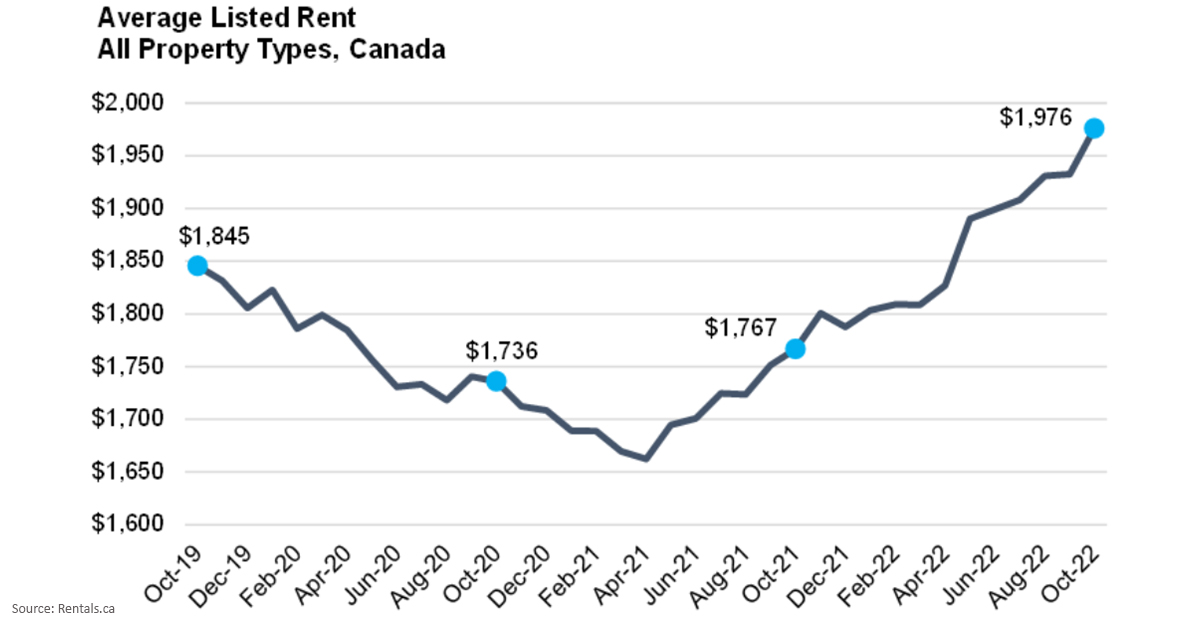
The vast majority (98%) of insolvent debtors in 2022 are renters, and rents continue to surge across Canada. According to Rentals.ca, rents rose 11.8% in October 2022 to an average of $1,976 across all property types.
Rising Interest Costs Affect Loan Affordability
It is not the amount of debt one carries that determines who has too much debt, but rather affordability relative to income. And all measures of loan affordability deteriorated significantly in 2022.
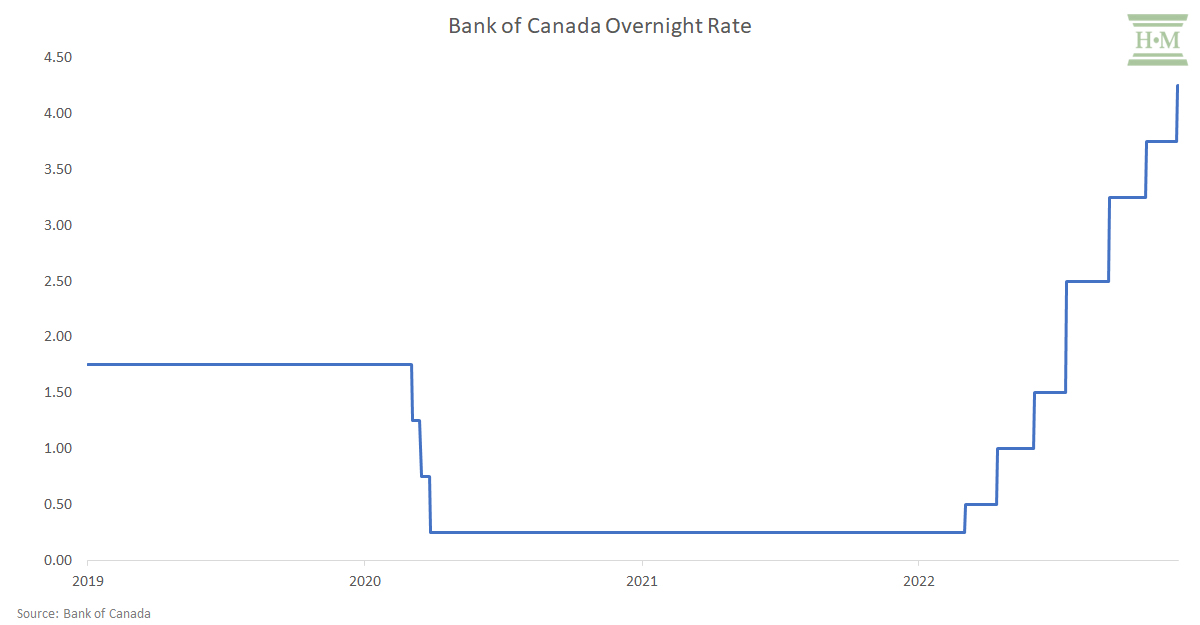
Interest rates rose in one of the fastest tightening cycles in Canadian history – adding another shock to household budgets. The Bank of Canada overnight rate rose 400 basis points to 4.25% by the end of 2022.
Not all credit products are sensitive to interest rate changes in the short term. Credit card rates, while they can change, seldom do. Existing term loans are locked in for the duration of the loan, although new loans, like car loans, will be at higher rates. Variable-rate mortgage holders may have a fixed payment which will remain in place until they reach their trigger rate.
However, rising rates do have an immediate effect on cash flow for many indebted Canadians:
- Those with a line of credit or adjustable rate mortgage saw an immediate increase in interest payment costs.
- Rising inflation and declining loan affordability will force many to reduce their monthly credit card payment towards the minimum payment, increasing the amount they will incur in long-term interest and adding circular pressure to their household finances.
- We may see a further reliance on high-interest loans as traditional banks tighten credit policies and consumer cash and credit reserves run out.
Rising interest payments mean more budget pressure. The debt service ratio (total debt payments as a percentage of disposable income) increased to 13.97 in Q3 2022 – the highest rate since Q4 2020. However, even this ratio appears better than it is. Households can control the principal portion of consumer credit by reducing their payment toward the minimum. This gives the perception that debt affordability is better than it is. In fact, the interest-only portion of the debt service ratio increased to 51.3% in Q3 – the highest since Q1 2011.
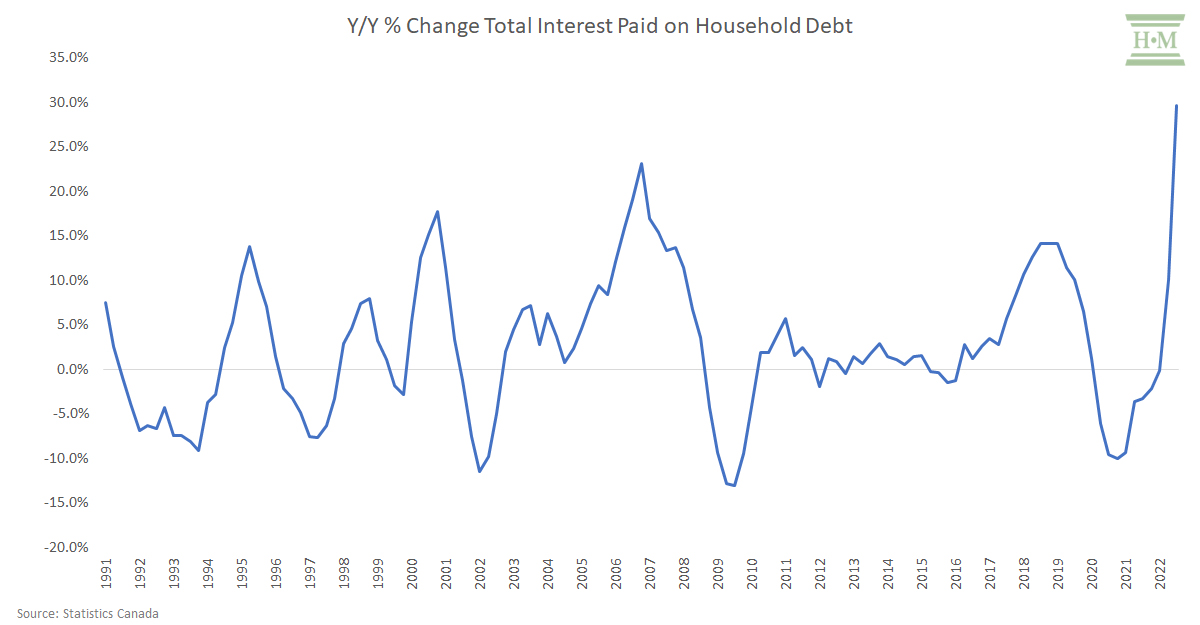
Total interest paid on household debt increased an astounding 29.6% year-over-year in Q3 2022, beating the previous peak back in 2006. After years of both a low and steady interest burden, consumers have been hit fast and hard with rising interest costs.
And it’s not just mortgage debt that is to blame. Non-mortgage consumer debt interest is also rising again, up 23.5% in Q3 2022 compared to a year earlier.
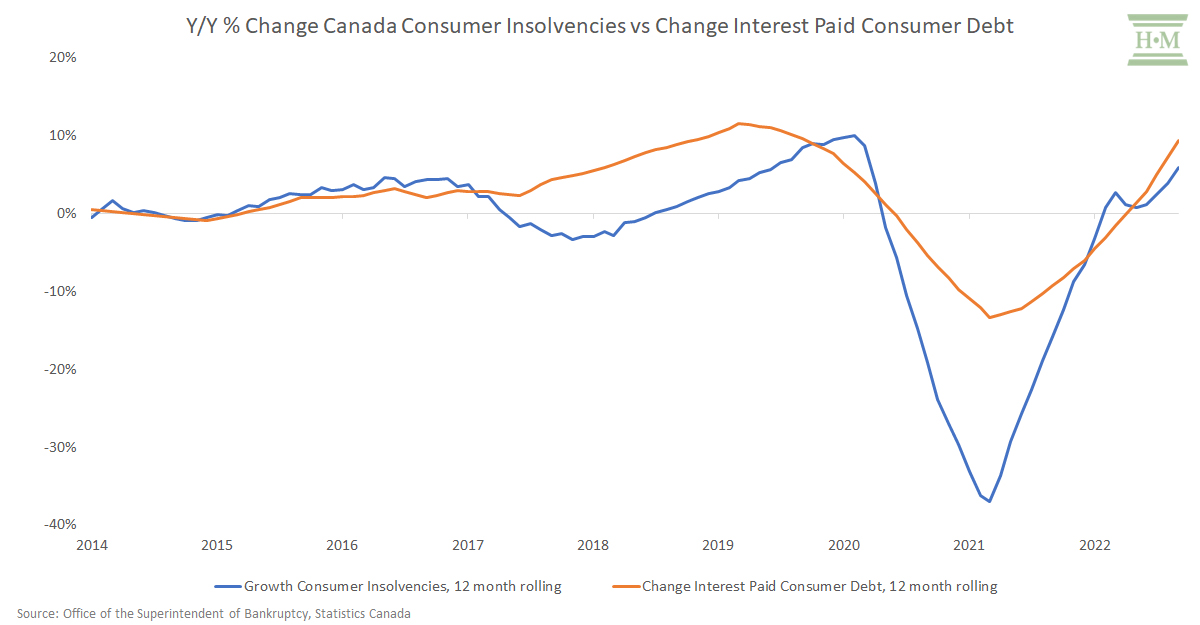
We already saw a connection between increasing household interest burden and rising consumer insolvencies during the two years just prior to the pandemic. There is no doubt the rapid rise in interest costs in 2022 will spur a similar trajectory of growth in consumer insolvencies.
Savings Rate Declining as Cash Reserves Run Low
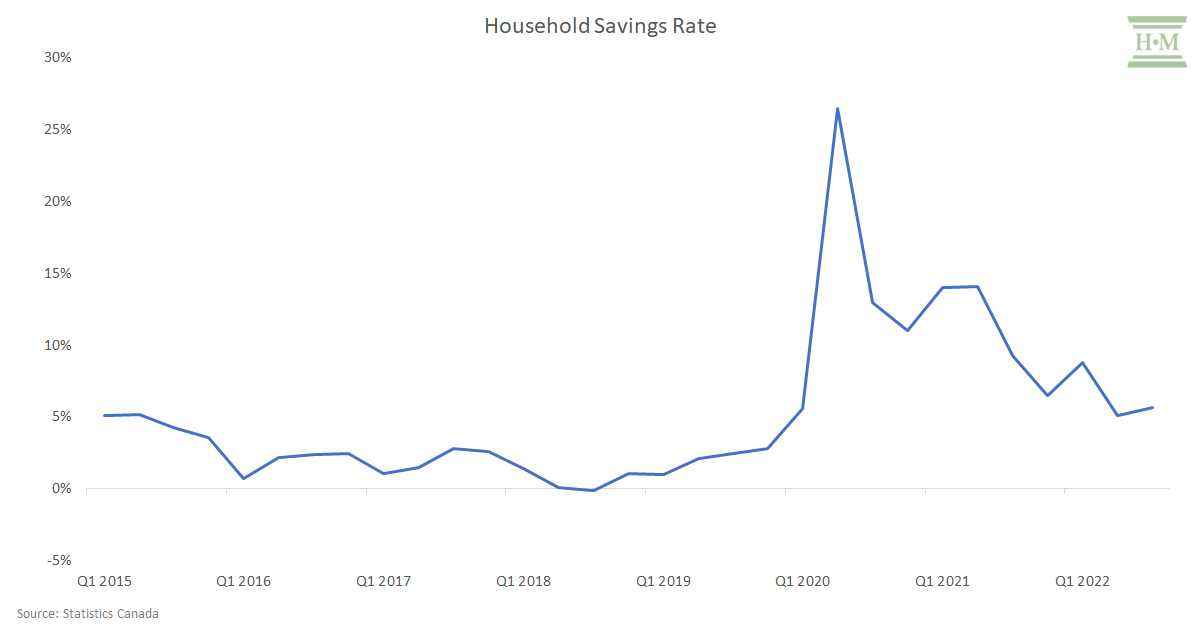
Both inflation and rising rates are putting pressure on household savings, with the household savings rate falling to 5.7% as of Q3 2022. While still above pre-pandemic levels, consumers are using up any cash reserves.
While homeowners may (currently) have sufficient home equity to borrow against to cover the rising cost of living and any potential income shock, renters (the bulk of insolvent debtors today) are quickly running out of liquidity.
Household Credit Still Growing, It’s Now Shifting Towards Consumer Credit Products
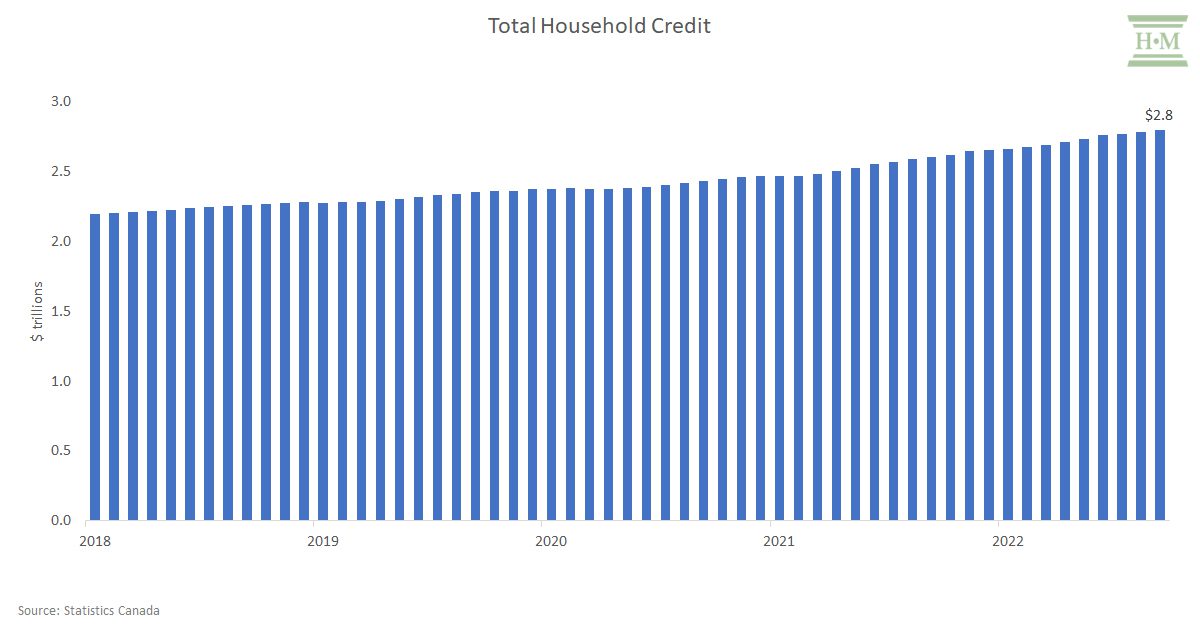
Despite rising interest rates, Canadians continue their love affair with debt. Total household debt reached $2.8 trillion in September 2022 – another record high. While growth rates are slowing, they are still historically high, and I must point out, growing on already very high balances. Total household credit grew 7.2% in September 2022.
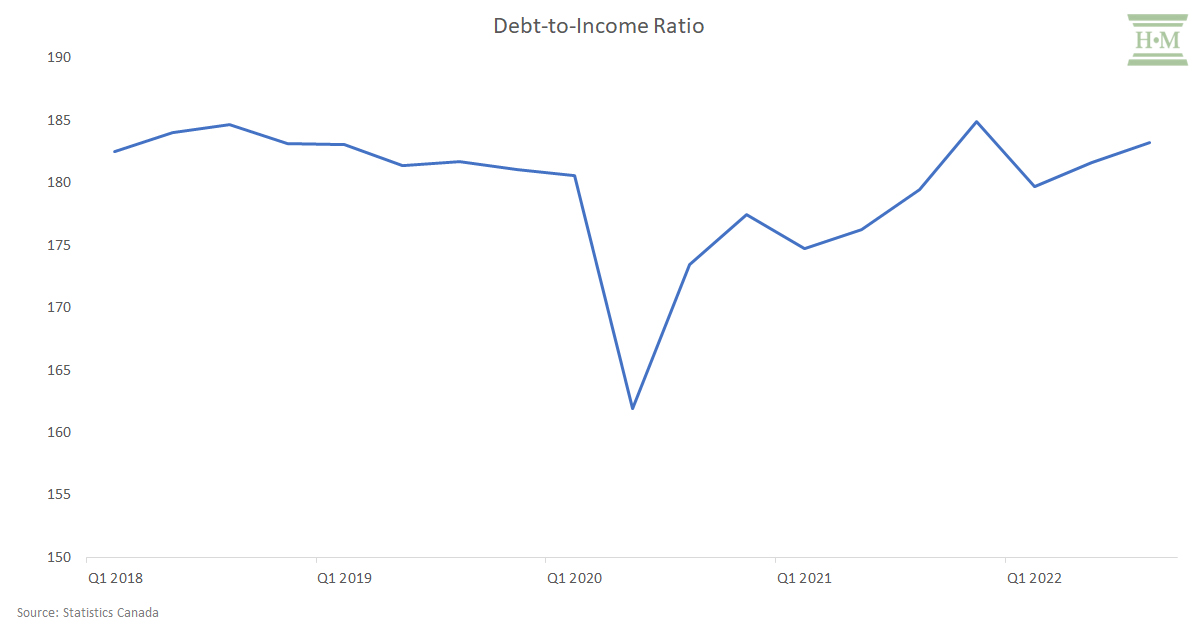
And Canadians are once again growing debt balances faster than income growth.
Household debt as a ratio of disposable income has returned to pre-pandemic levels. Canadians owe $1.83 for every $1 they earn.
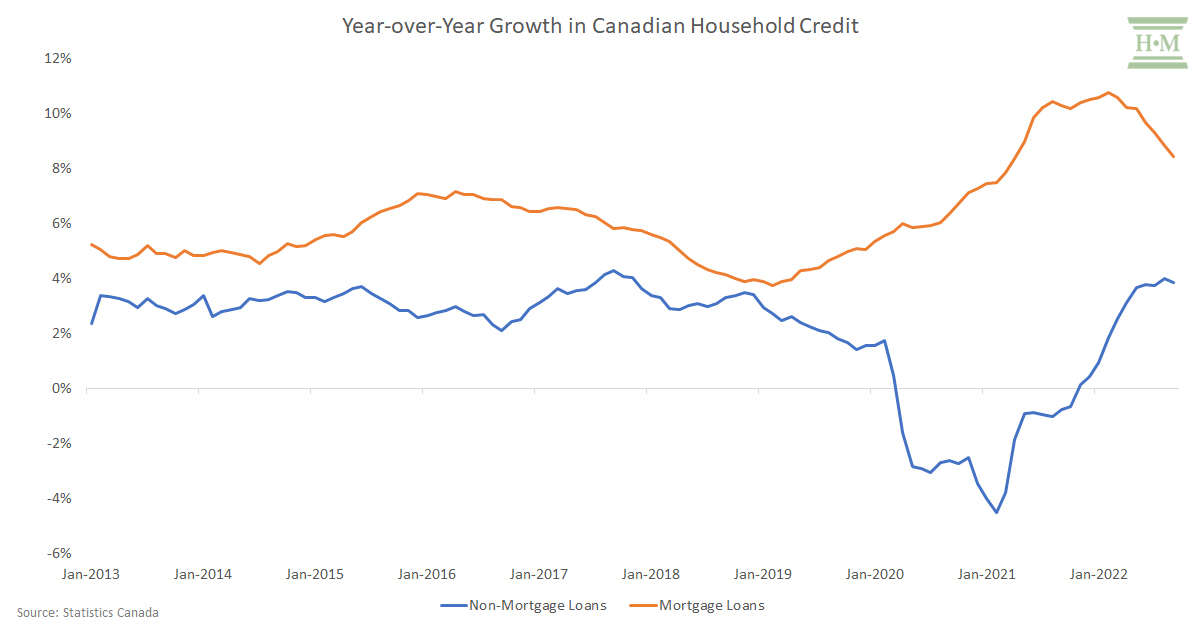
What has changed is that we’ve switched from increasing mortgage growth to a return to rapidly growing consumer debt.
Mortgage growth slowed to 8.4% in September 2022, while non-mortgage loans went from declines during the pandemic to a growth of 3.8%.
In other words, Canadians building balances are doing so across primarily unsecured products – credit cards, lines of credit and personal loans. These are the types of loans dealt with through a consumer insolvency filing.
Credit Cards – Record Balances
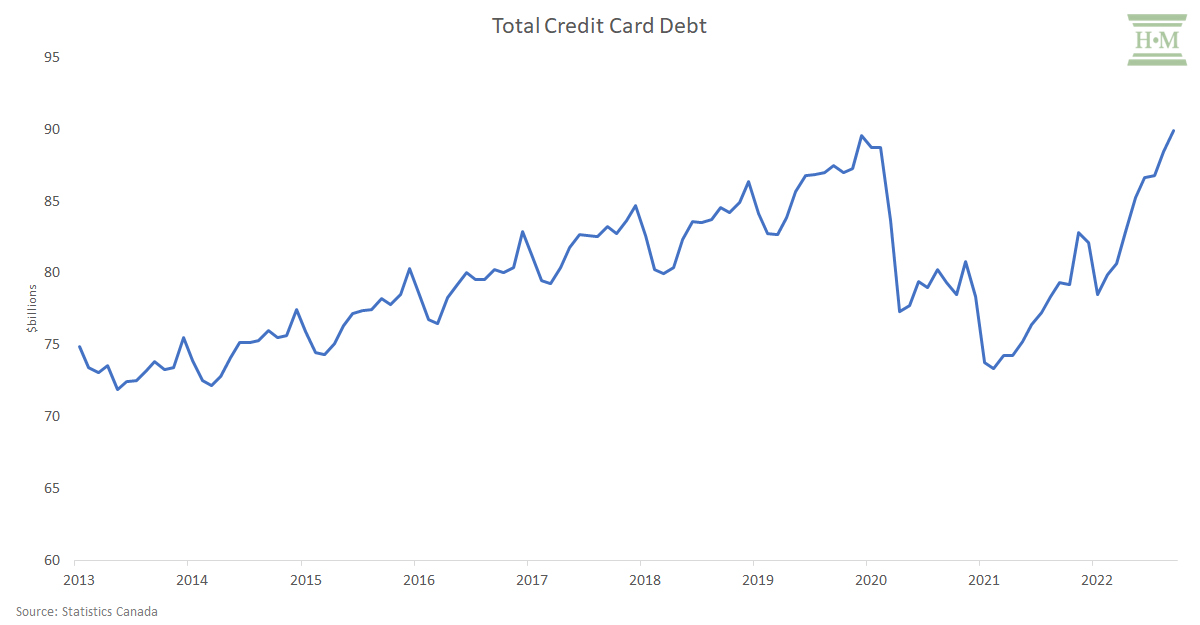
Credit card balances are back to pre-pandemic levels. Any gains borrowers made in repaying their credit cards amid the lockdowns of the last two years are now lost.
Canadians now owe a whopping $89.9 billion in credit card debt as of September 2022 – the most we have ever owed.
Worse, the current credit card debt total is above the pre-pandemic peak in December 2019, when we owed $89.6 billion. Historically, December is when annual credit card debt peaks, and it’s alarming that Canadians are already near the $90 billion mark in September 2022.
Balances are rising due to a perfect trifecta:
- Rising credit card spending due to inflation as Canadians use credit to pay for living expenses. Equifax reported that average monthly credit card spending was up 17.3% in Q3 compared to Q3 2021.
- Increased demand and new credit growth as consumers look for more credit capacity (originations / new cards for Q3 2022 are up 35% per TransUnion).
- Credit card payment-to-balance ratios are falling as people lower their payments toward the minimum. Equifax also reported that average payment rates for those who carry a balance are lower than 12 months earlier.
Credit cards are troubling because they are an easily accessible form of revolving credit when cash flow becomes a problem and can be an early step in the events leading to insolvency.
Rising balances also mean growth in the minimum payment required, putting even more pressure on an indebted person’s budget.
Lines of Credit – Climbing Again
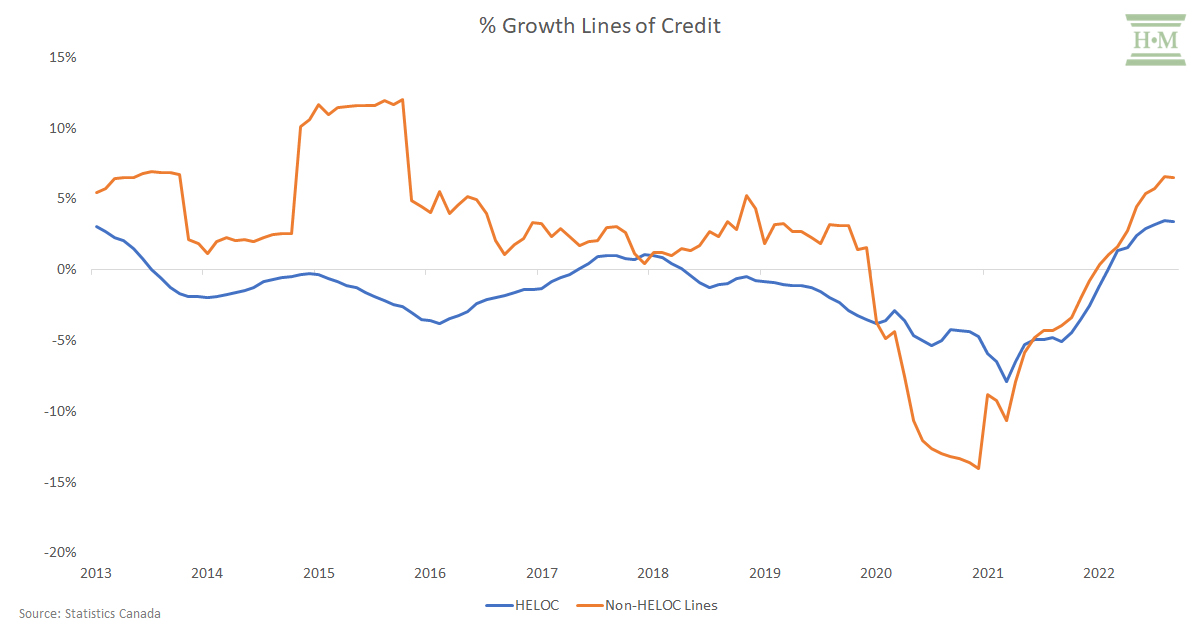
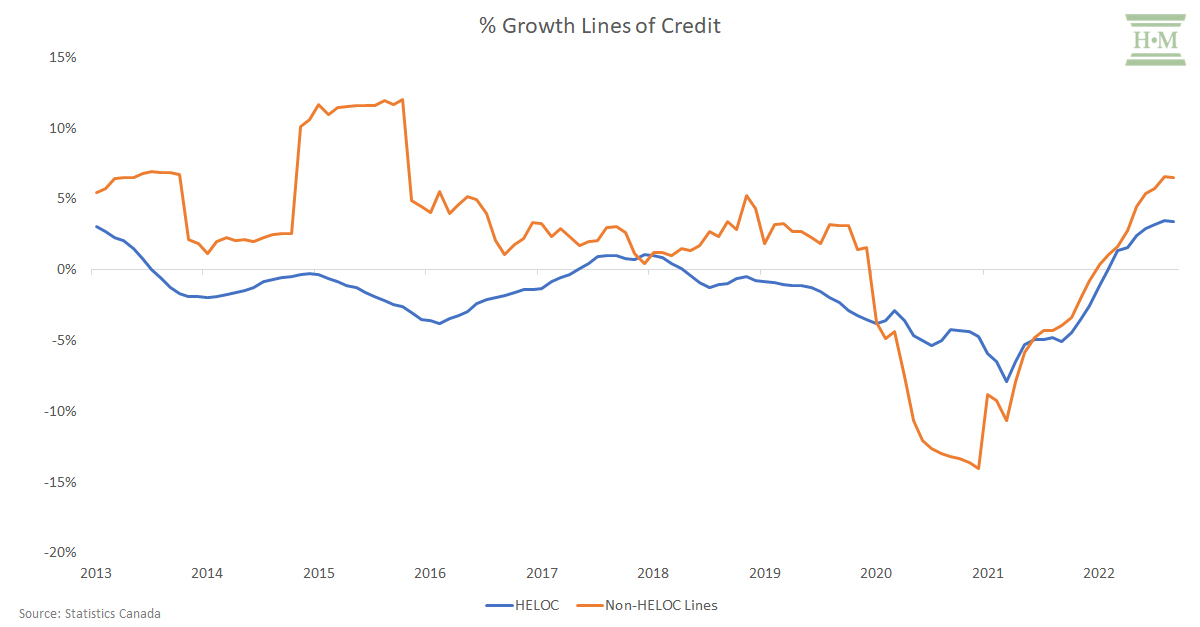
Line of credit debt is also climbing quickly, although we are not yet at pre-pandemic peaks.
Once again, non-mortgage (unsecured) lines are growing faster than secured HELOC lines. While all lines of credit balances increased 4.2% year-over-year in September 2022, non-HELOC lines increased 6.5% while HELOCs were up 3.4%.
Unsecured lines of credit are another driver of insolvency. Canadians now owe $67.6 billion in non-mortgage line of credit debt, the highest level since April 2020.
Consumer Credit Delinquencies Begin To Rise
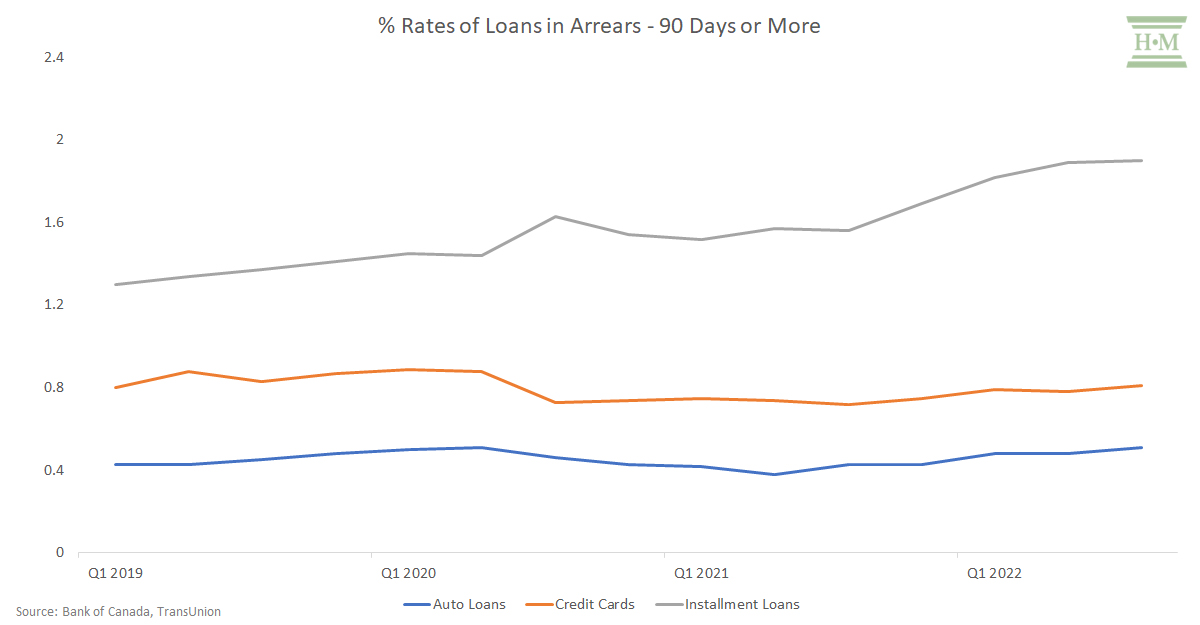
Delinquency rates (90 days or more) on consumer lending products – auto loans, credit cards, and installment loans – are also rising again.
Installment loan delinquencies have surpassed pre-pandemic levels. These include high-interest alternative loans from payday and fintech lenders, a source of borrowing we are increasingly seeing in consumer insolvencies. Since most of these loans are unsecured and non-revolving, consumers are likely to skip these loan payments before their rent, mortgage, credit card, line of credit or car payment. As a result, early delinquencies here may be a warning sign of even more trouble ahead for other credit products.
Auto loan delinquencies are also rising quickly, returning to pre-pandemic levels. Given that a car can be necessary for many Canadians to get to work, rising auto loan delinquencies are a strong indicator of a household’s lack of liquidity and inability to keep up with debt repayment.
Credit card delinquencies climbed to 0.81% in Q3 2022, a year-over-year increase of 12.5%. During periods of financial distress, consumers rely on credit cards to pay for everyday living costs. After mortgage payments, credit cards are one of the last loan payments people in financial trouble will miss. They will continue to do what they can to maintain minimum payments, including looking for new credit options to borrow more.
Two Big Unknowns –Unemployment and Housing Prices
Unemployment Decouples From Insolvencies
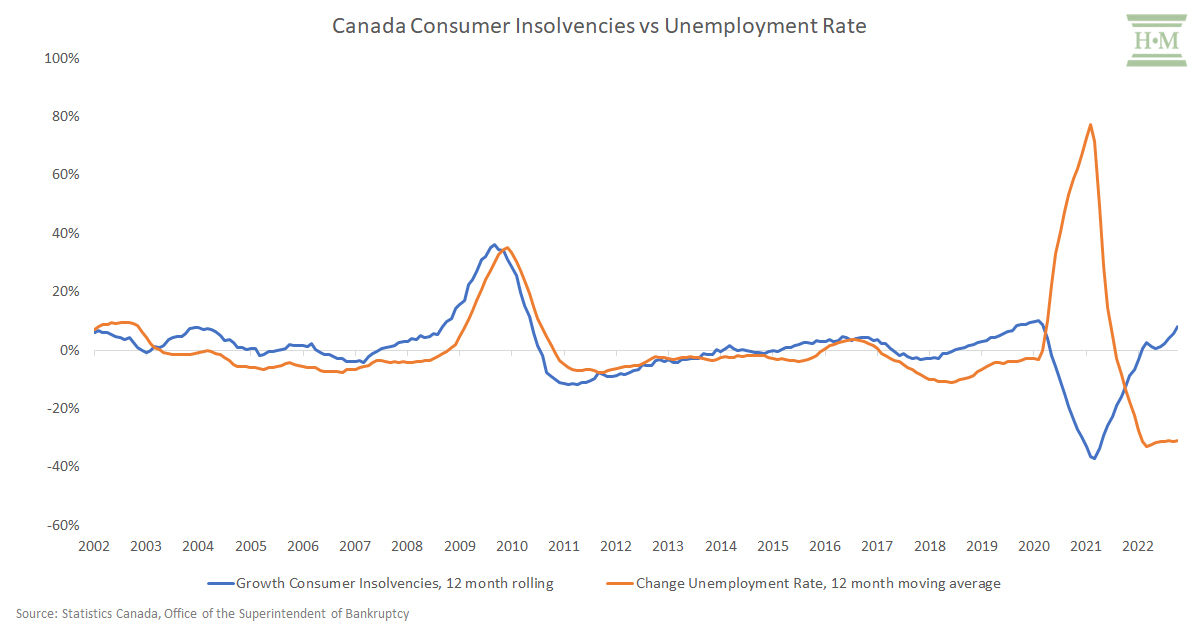
Historically, consumer insolvencies have trended closely with unemployment. However, this connection has decoupled in recent years.
It’s easy to understand the disconnect during the pandemic. Skyrocketing unemployment due to the lockdown was temporary. Further, government monetary support to consumers during the pandemic contributed to a sharp drop in consumer insolvencies.
However, even before the pandemic, we began to see a change in this pattern. In 2018 the unemployment rate in Canada fell by 8.0%, yet insolvencies increased by 2.5%. In 2019 we saw consumer insolvencies increase by almost 10% per year while unemployment fell a further 2.9%.
| Y/Y Change | ||
| Unemployment Rate | Consumer Insolvencies | |
| 2018 | -8.0% | 2.5% |
| 2019 | -2.9% | 9.5% |
| 2020 | 67.1% | -29.7% |
| 2021 | -20.6% | -6.6% |
| 2022 | -29.4% | 10.5% |
Why were consumer insolvencies rising so rapidly before the pandemic despite low unemployment? The likely answer: rising overall consumer debt levels, particularly non-mortgage consumer credit and a trend towards more subprime debt options.
What’s clear from our earlier analysis is that the pre-pandemic trend toward consumer debt growth has returned. In my experience, unsecured consumer debt does not build wealth. It generally grows to fund consumables, and a return to high unsecured debt balances is a precursor to insolvency growth. And any recession and a resulting rise in unemployment combined with the pent-up impact of all this extra debt will further accelerate any growth in consumer insolvencies.
Homeowners still have equity
In recent years, few homeowners filed insolvency despite carrying high consumer debt for two reasons: low interest rates and rising home prices.
We’re at the end of 2022 with a Bank of Canada overnight rate of 4.25% – the highest interest rate since 2008.
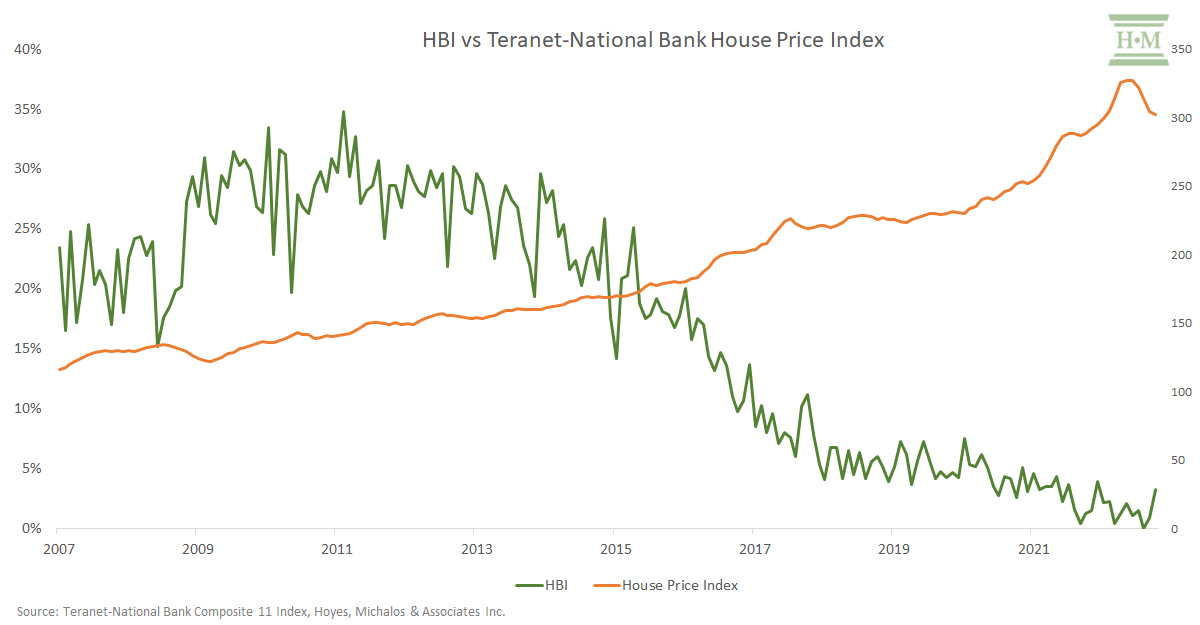
Home prices have declined somewhat as demand softened due to interest rate increases. Yet, homeowner insolvencies remain low. Our Hoyes Michalos Homeowners Bankruptcy Index remained historically low in 2022, averaging 1.6% in the first 11 months and, in fact, reaching zero in August.
There are a few reasons why homeowner insolvencies remain low, at least for now.
Chief among them, mortgage payments will not rise immediately for most. Borrowers with a fixed-rate mortgage will not see their mortgage payments rise until their mortgage is renewed. For variable-rate mortgage holders who have reached their trigger rate, lenders are likely to extend amortization and even allow negative amortization before provoking a potential mortgage default.
It is worth noting that the composite house price index is falling. In October 2022 it was 302.21, 7.7% below its peak in April 2022.
Current home price drops will not trigger an avalanche of homeowners insolvencies, as most still have enough home equity to refinance. However, refinancing may become impossible or too expensive depending on how high interest rates rise and how long they stay elevated. We do expect to see a slight rise in homeowner insolvencies in 2023.
More Insolvent Debtors Filing Consumer Proposals
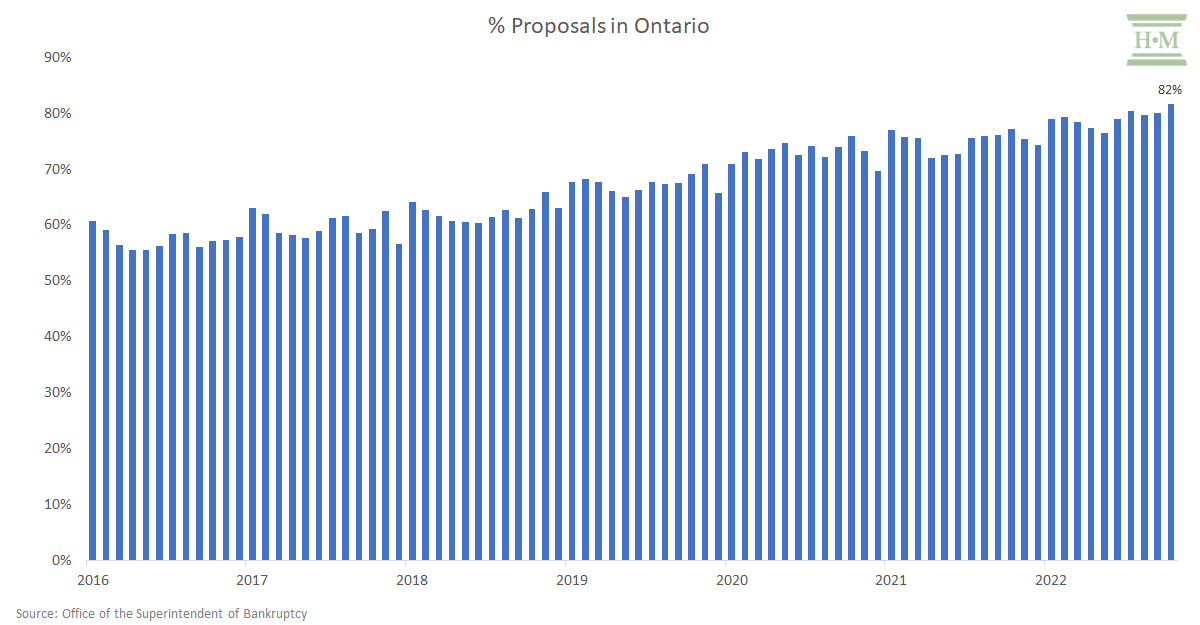
Another trend worth highlighting is that consumer proposals, as a share of all consumer insolvency filings, has reached record highs in 2022.
In October 2022, Ontario consumer proposals accounted for 81.6% of all filings, compared to 77.2% Canada-wide.
While homeowners are not filing for insolvency in 2022, low unemployment and the cost-benefit of filing a consumer proposal over bankruptcy for higher-income earners are likely driving this trend. A consumer proposal allows the insolvent debtor to spread the cost of their insolvency proceeding over five years, lowering the monthly payment and making a consumer proposal more affordable.
In conclusion, and what’s to come:
The past two years have been interesting in the consumer insolvency world, with overall insolvencies dropping to 20-year lows during the pandemic. Even today, consumer insolvencies have only returned to 2007-2008 levels, with the last three months’ volume remaining 23% below pre-pandemic highs.
My take is that in terms of economic drivers, we are close to pre-pandemic pressures. I expect we will return to a similar growth trajectory that we saw pre-pandemic, which means double-digit consumer insolvency increases continuing into 2023. However, I do not see us reaching pre-pandemic highs in terms of volume until 2024 at the earliest.
If you want to hear specific predictions on how much higher insolvencies will rise in 2023, tune in to the podcast with myself and my co-founder, Ted Michalos, airing on December 31, 2022.
In 2022, these are the top 10 debt statistics I believe impacted (or will impact) the affordability of unsecured consumer debt and consumer insolvencies:
- Ontario consumer insolvencies up 13.5%, Canada up 10.5% – year-to-date to October 2022
- Inflation to wage growth gap 2.6% – year to date October 2022
- Bank of Canada interest rate 4.25% – as of December 2022.
- Total interest paid on household debt up 29.6% – Q3 2022 vs Q3 2021
- Household savings rate 5.7% Q3 2022 – and declining
- Debt-to-income ratio $1.83 Q3 2022 – back to pre-pandemic levels
- Credit card debt $89.6 billion September 2022 – above pre-pandemic highs and rising
- Unsecured line of credit growth 6.5% September 2022 – and rising
- Homeowner Bankruptcy Index 1.6% YTD November 2022 – still low (November 2.3%)
- Consumer proposals as share of all insolvencies in October 2022 81.6% Ontario, 76.1% Canada – a record high
Sources:
https://ised-isde.canada.ca/site/office-superintendent-bankruptcy/en/statistics-and-research
https://www150.statcan.gc.ca/t1/tbl1/en/tv.action?pid=1810000401
https://www150.statcan.gc.ca/t1/tbl1/en/tv.action?pid=1410032001
https://rentals.ca/national-rent-report
https://www.bankofcanada.ca/rates/interest-rates/canadian-interest-rates
https://www150.statcan.gc.ca/t1/tbl1/en/tv.action?pid=3610063901
https://www150.statcan.gc.ca/t1/tbl1/en/tv.action?pid=1110006501
https://www150.statcan.gc.ca/t1/tbl1/en/tv.action?pid=3610011201
https://www150.statcan.gc.ca/t1/tbl1/en/tv.action?pid=3810023801
https://www.globenewswire.com/news-release/2022/12/06/2568012/0/en/Total-Consumer-Debt-Climbs-to-2-36-Trillion-as-Consumers-Lean-on-Credit-Cards.html
https://www.bankofcanada.ca/rates/indicators/indicators-of-financial-vulnerabilities/#Household-credit-performance
https://www150.statcan.gc.ca/t1/tbl1/en/tv.action?pid=1410028701
https://housepriceindex.ca/2022/11/october2022/
https://www.hoyes.com/press/homeowner-bankruptcy-index/
https://www.bankofcanada.ca/2022/11/staff-analytical-notes-2022-19/


